
In January 2020, during the first weeks of the outbreak, most financial analysis of the impact of the coronavirus Covid-19 have focused on the numbers of infected patients, as well as the number of deaths and remissions.
These numbers are extremely important in understanding public health impact, virus propagation, and the increasing probability of this outbreak becoming a catastrophic pandemic.
As weeks went by, the disclosure of the increased containment measures in China brought the spotlight to the first economic consequence of this crisis, namely a “demand shock”, that is a significant decrease of the revenue of some major industries due to the rapid change in behavior of their Chinese customers: oil, luxury goods, travel and hospitality, alcoholic beverages, entertainment were hit.
However, important supply chain consequences were understood much more slowly. By supply chain consequences, we mean the understanding of the impact caused to the worldwide manufacturing system by the Chinese manufacturing disruption. It is now (on Friday February 28) called the “supply shock” that will manifest independently of the aforementioned “demand shock”.
By analyzing in real time over 30,000 documents per day in 18 different languages, and with a corpus of over 80 million documents covering the past six years, Causality Link is well positioned to track the evolution of this crisis in real time. As we not only track sentiment, but also causal links as they are explained by thousands of authors, we are able to surface the propagation and evolution of multiple explanations of the consequences of the crisis across the world.
Our analysis reports the evolution of the collective understanding of this crisis and the forces that drive its evolution.
Three Overlapping Phases: People, Demand, Supply
The people phase concentrates on the number of newly infected people per country and per day, as well as the number of deaths and the number of survivors. This phase draws a lot of media attention with very little explanation of the potential economic impact of this news or the panic they generate. We show here all the mentions of the epidemic in their geographical context.
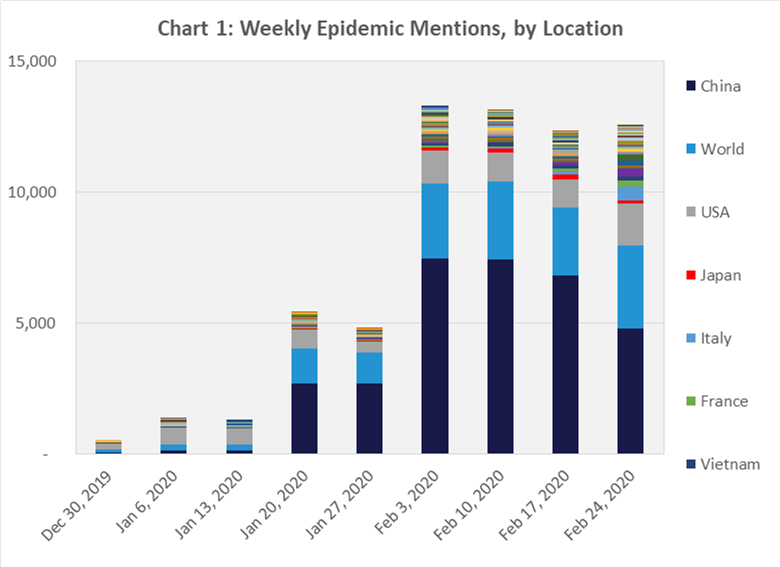
Our system detects the peaking of the dark blue mentions (China), the increase of the pandemic discussion (World) and increasing worries in the US, as well as the spike in Japan, Italy and now France. We have aggregated our detections per week and do not doubt another spike over the next week due to the geographic expansion of the pandemic.
The demand phase follows the people phrase with the announcement of government established restrictions to travel, which hits instantly demand for business and leisure travel, and adjacent industries: airlines, luxury goods, tourism, restaurants and alcoholic beverages, as well as oil.
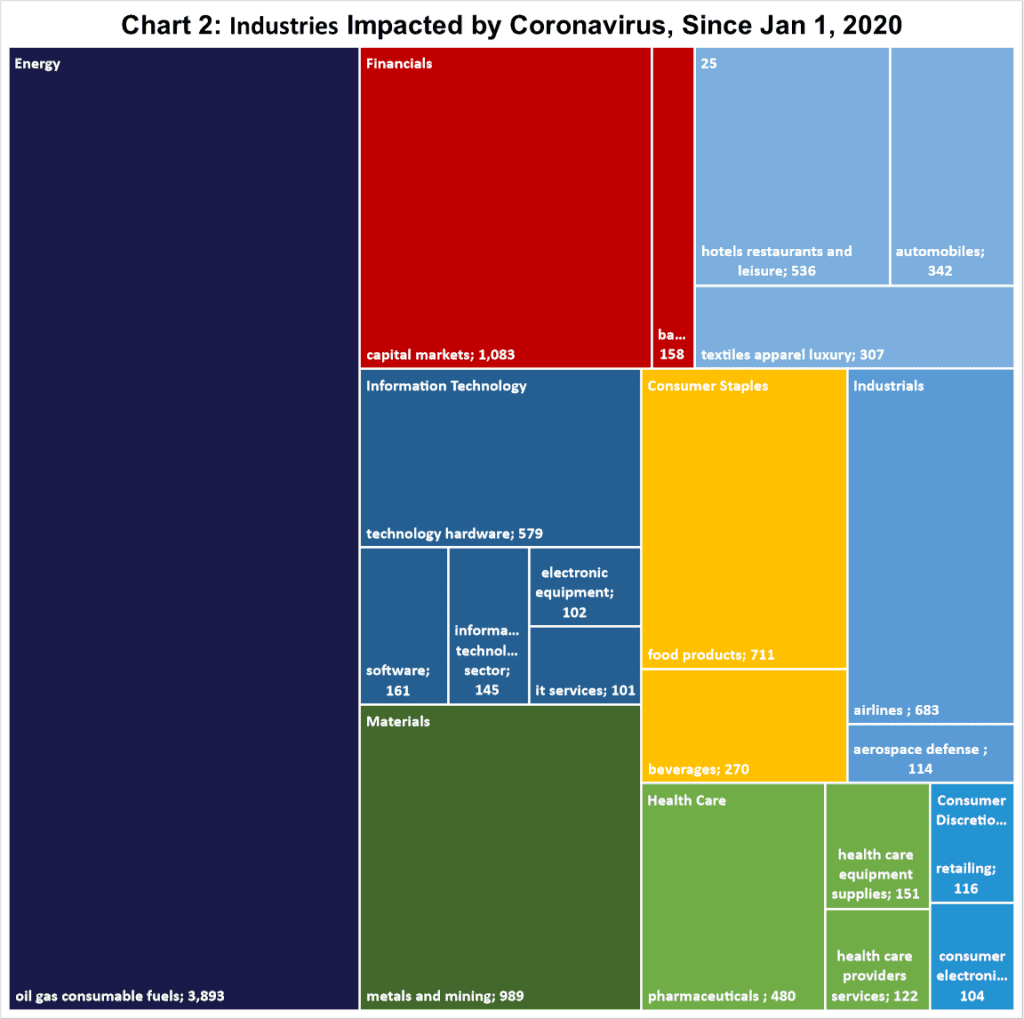
Chart 2 highlights the different industries mentioned in the context of the coronavirus and is a good proxy for the current thinking about the impact of the epidemic on different industries. By far, the most talked about impact concerns the reduction in oil consumption linked to manufacturing stoppages and travel restrictions, either voluntary or mandated by governments. The financial sector and metals and mining share second place in terms of perceived negative impact. Airlines, hospitality and electronics are close thirds.
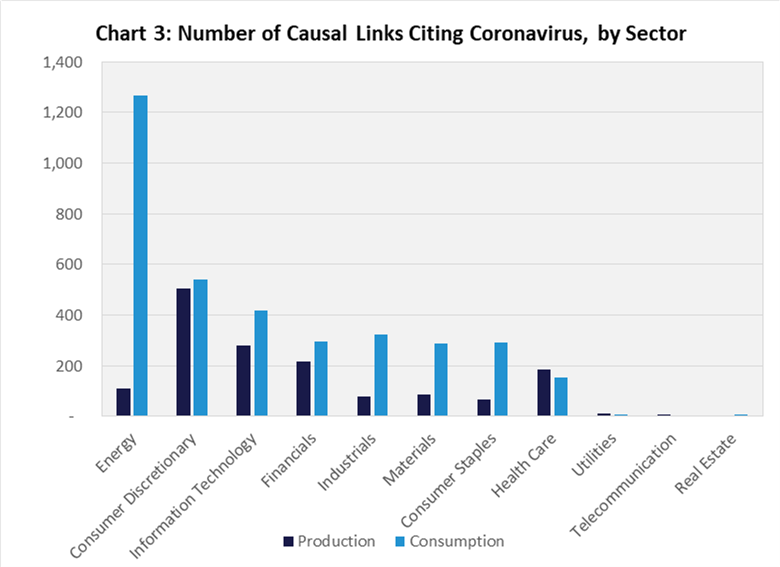
Another way to look at the negative consequences of the epidemic by sector is offered in Chart 3 which shows the number of detected causal links between the Coronavirus epidemic and negative consequences for different sectors. The blue bar shows the negative consequences on consumption (demand, sales, etc.) and the black bar the negative consequences on the production (supply side).
We can also observe that in this chart again, the negative impact of the Chinese quarantine measures on oil prices is very prevalent in the news (the Energy Sector) and more generally that the same sectors as in Chart 2 are considered as being at risk of consequences from the decrease in demand by consumers.
Our system which analyzes the results of more than 40,000 companies worldwide also offered us some examples of a more precise early detection through the early announcement by the French company Pernod Ricard on February 13 that its revenues were going to experience “a severe impact on the third quarter” but hoping for “a gradual resumption of sales in March and a return to normal in June” for their Chinese sales. This was the canary in the coal mine for the alcoholic beverage industry. The CEO explained to AFP that (on Feb. 13) “by the time I speak to you all nightclubs, all night bars are closed in China until further notice”, and among the cafes hotel restaurants that are open, “they are pretty empty, people are at home, rightly so”. We can expect such issues to expand to all countries seriously touched by the pandemic.
Finally, the supply phase is more insidious, as it relates to the impact of the absence of parts or manufactured goods linked to the closure of the plants responsible for their production.
This impact is delayed by two supply chain characteristics: the time to transport parts from the producing plant to the consumer plant (which can be up to 6 weeks when the parts are shipped from China by containers), and the existence of parts inventory at every manufacturing capability. The “just-in-time” mantra has reduced this inventory worldwide to less than two weeks for most supply chains.
However, the impact can be devastating for manufacturing, as “one does not sell a car with only 99% of its parts”, meaning that all parts have to be available, and that the failure of just one of the critical providers can bring a plant to a standstill.
We can observe on Chart 3 that the detection of causal links impacting negatively the production of goods yields much less counts than the detection on the negative impact of demand of these goods. This highlights that the “demand phase” is currently much more prevalent in our corpus than the “supply phase” whose impact is delayed by up to two months.
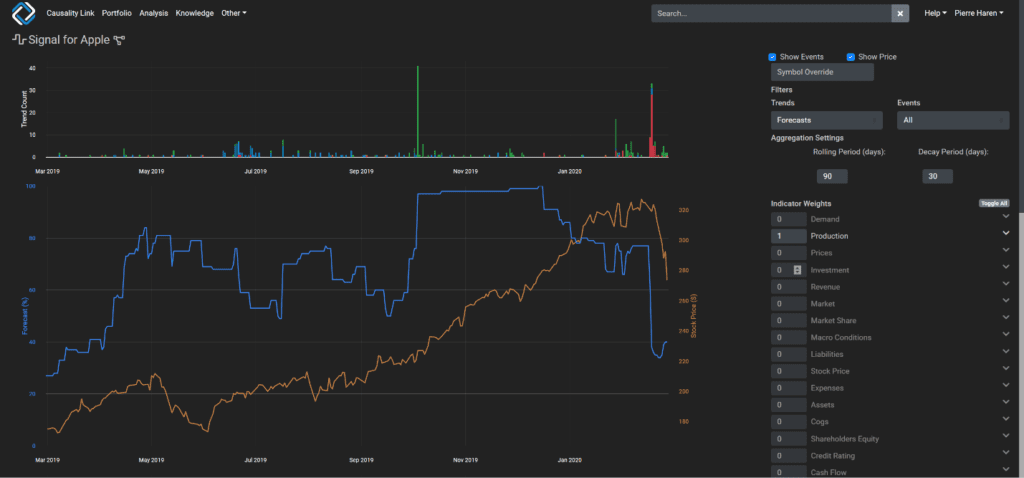
Apple was one of the first large companies to announce on Feb 17 that it would be supply-constrained (“worldwide iPhone supply will be temporarily constrained”) after a positive results announcement on Jan 28. This event was instantly detected by our system and triggered quite a drop in Apple stock price.
The Next Steps: People, Demand, Supply Across the World
Our current analysis of the impact of the epidemic in China and the first few countries in which it has expanded could be used as a guide for the prediction of what will happen to the US in the coming weeks.
First, we will be hit by the demand consequences of the current situation in China. Many companies who were selling into the Chinese market will experience a drop in revenue due to the strong drop of consumption in this market but not all of them have made public the anticipated consequences of this drop in demand.
Then the supply consequences will hit us, as many of our manufacturing facilities are dependent on a constant flow of parts from China.
We will then be hit by the demand and supply consequences of the pandemic reaching our European partners, with identical reduction in demand and potentially travel restrictions slowing down their own manufacturing capabilities. Today, we do not hear much about the impact on US manufacturing of a hiccup in German manufacturing, but this seems unfortunately inevitable at this point.
Finally, we likely will have to go through our own “people, demand and supply” phases. While it is not clear how much of the Chinese quarantine measures will have to be implemented in the US, we must know that until a cure or a vaccine is found, we are definitely facing an identical future as the present of our Chinese fellow humans.