
By Olav Laudy, Lionel Jouffe and Pierre Haren
March 19, 2023
In financial news, authors often offer causal statements to explain why market movements are happening: why inflation is surging or declining, why some companies increase profits and valuation, why others face difficult times, etc…
Each of these causal statements represents a piece of knowledge that the author is sharing as an insight into the forces driving the markets. These statements can be original to the author, or just repeated from another author. In all cases, they represent what an author considered a valuable insight supporting his thesis.
The human readers of these news will gather thousands of such statements as knowledge and will aggregate those into their own thesis over time, with volume limitations coming from their available time to read, and their limited access to worldwide news in multiple languages. Once they have a formalized thesis, they may want to perform some sensitivity analysis on this thesis, and the most mathematically oriented users will leverage Bayesian Belief Network modeling tools. This will require that they model the different variables in play, the relationships between these variables, the marginal and conditional probabilities of these variables, before being able to use such a model for decision support.
In this article, we demonstrate the advantages of a fully automated solution resulting from the combined offerings of two companies, Causality Link (www.causalitylink.com) and Bayesia (www.bayesia.com). This solution leverages Natural Language Processing on tens of millions of financial texts to collect such causal statements, performs an automatic analysis to generate on demand dedicated Bayesian Network definitions focused on specific macro-economic or company targets, and transforms these models into editable and executable Bayesian Networks for analysis and simulation purposes.
Financial decision makers can then start with such a graphical model and refine it with their own causal beliefs or probability distributions, bypassing the tedious phase of knowledge elicitation with their own experts and diving directly into the sensitivity analysis that delivers the most information before a decision.
The paper will focus on the two main parts of this process: the extraction and building of the Bayesian network from texts, and the usage of the network once imported into the BayesiaLab platform to gain deeper insights into financial topics.
Identifying Patterns and Leveraging the Wisdom of Crowds
By collecting causal statements at scale, investors and researchers can identify patterns and trends that may not be immediately apparent from individual news articles. For example, if many articles mention a causal relationship between rising interest rates and falling stock prices, investors may want to consider shorting stocks in industries that are most vulnerable to interest rate hikes. Similarly, if many articles mention a causal link between high oil prices and decreased consumer spending, investors may want to decrease their investment in industries that are heavily reliant on consumer spending when the oil price increases.
More importantly, the forces that are acting on markets are changing over time. Global warming has increased the cost of food production, and the Ukraine war has decreased the availability of fertilizers worldwide. Understanding how this web of influences dynamically interacts with companies or commodities is a challenge as hundreds of relationships must be memorized and weighted against each other. When these variables interact with each other and conditional probabilities are needed to estimate the probability of a rise in price, human brains reach their limits and require the help of computers.
Extraction of Causal Relationships from Text
Causality Link has developed a method for extracting causal explanations from financial texts. For example, the sentence “Dubai started the new year by suspending its 30 percent tax on alcohol, a move that could help the Gulf emirate attract more tourists and businesses amid growing regional competition” links the Dubai alcohol tax suspension to a predicted increase in the Dubai tourism industry.
The extraction of causal explanations requires a specific modeling of the two elements linked by a causal explanation. For example, one of these elements can be an object that contains a Key Performance Indicator (KPI) or event, such as tax or revenue, and a context to refine it, such as a product, a company, an industry, or a location. In the case of the Dubai alcohol tax suspension, the KPI is “tax” with the contexts “alcohol” as an industry and “Dubai” as a location.
One of the key elements of the process is the ability to generalize the detected entities to an appropriate level. Causality Link is using a set of taxonomies that allow the aggregation of entities to their higher-level concepts. For example, the segment “alcohol” would aggregate to the industry “beverages” and the location “Dubai” aggregates to “United Arabic Emirates,” leading to a node called “uae-beverages-taxes” impacting the tourism industry. This aggregation method reduces the variability of nodes in a causal network and provides a strong performance advantage for querying and reasoning without losing much of the semantics of the documents.
Causality Link has been developing this method over the past 5 years, resulting in a data lake with approximately 50 million causal links that describe the relationships between all entities in the financial world. These causal links are time-stamped and provide insight into how the understanding of the forces impacting the financial world has evolved over time.
In addition to the extraction of causal links, Causality Link also extracts entities and their associated trends. For example, in a sentence like “we expect the oil inventory to be negatively impacted,” the KPI “inventory” is associated with the industry “oil gas consumable fuels” and is expected to decrease in the future. These extracted trends are transformed into a synthetic signal which represents the aggregated point of view of the authors of the analyzed corpus about the past and future evolution of all the detected entities.
Finally, Causality Link detects a wide variety of events, which can be elements of a causal relationship as in “Brexit led to a decline of the strength of the British Pound”.
In summary, the process of extracting Causal Relationships from texts involves the detection of KPIs and events, the detection of contexts, the generalization of entities to the appropriate level, the extraction of trends and the detection of causal statements. Causality Link has developed a method for achieving these objectives, resulting in a rich data lake of causal links and trends.
For example, here is a fraction of the causal graph for the country Brazil, as extracted on March 5, 2023.
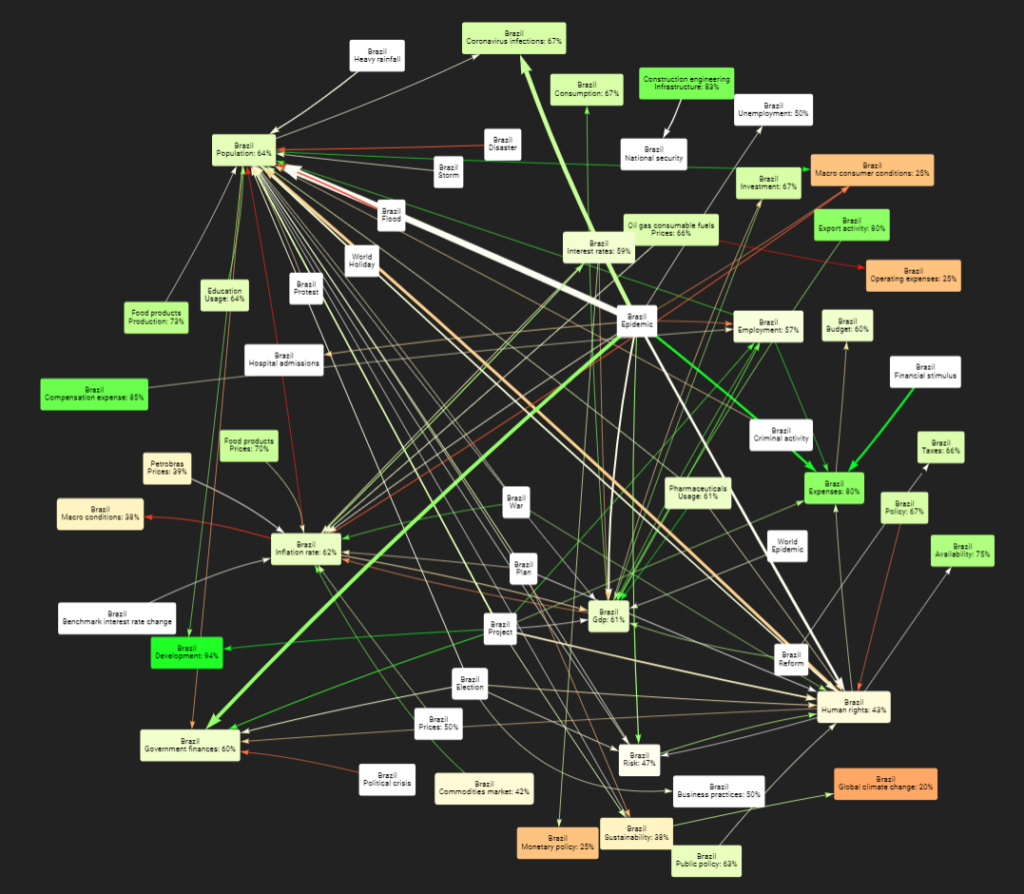
This graph represents all the detected causal relationships to and from any node that contains Brazil, where we don’t show the relationships whose count is below a certain threshold. It is a direct representation of the results of a query on Causality Link data lake of causal link automatic detections from texts.
While the graph is clearly too complex for human consumption, we can see that “Brazil inflation rate” is influenced by Food Product Prices, Petrobras Prices, Brazil Commodities Market, Brazil GDP and a few other factors.
It is now possible to apply a further transformation to this causal graph to obtain a Bayesian Belief Network (BBN) focused on any specific target, as described in our JFDS paper [ref].
Bayesian Belief Networks
Bayesian Belief Networks (BBN), also known as Bayesian Networks or Bayesian graphical models, are a type of probabilistic graphical model that represent relationships between variables and the probabilities associated with these relationships. They are widely used in fields such as machine learning, data mining, artificial intelligence, and decision making as they provide a powerful tool for reasoning about uncertainty.
They allow us to model complex systems and make predictions about the future based on past observations. They are particularly useful in fields such as healthcare, finance, and engineering, where decision making is often based on uncertain or incomplete information.
Bayesian Networks represent the dimensions of the domain as nodes in a graphical model. The nodes are connected by directed links, which represent causal relationships between the connected variables. The parent nodes are then the causes of the child nodes. These relationships are quantified with conditional probabilities, which describe the probabilities of the children given the states of their parents.
Bayesian Networks model uncertainty by representing the joint probability distributions of all variables in the network. The posterior distributions are updated as new evidence becomes available, allowing to make predictions about the future. This ability to model uncertainty makes Bayesian Networks an essential tool for decision making in uncertain environments.
At the company level, Bayesian Networks can be used to model and predict financial performance, including stock prices, earnings, and revenue. For example, a Bayesian Network could be used to model the relationship between a company’s sales, marketing efforts, and stock price. The network could then be used to make predictions about the company’s future performance based on past observations and current economic conditions.
At the macro level, Bayesian Networks can be used to model and predict economic trends, such as inflation, interest rates, and currency exchange rates. For example, a Bayesian Network could be used to model the relationship between interest rates, inflation, and economic growth. The network could then be used to make predictions about the future performance of the economy based on past observations and current conditions.
Transforming a web of causal relationships into a Bayesian Belief Network
The process the Causality Link system will go through has been described in detail in the article “Building Probabilistic Causal Models Using Collective Intelligence” by Olav Laudy, Alexander Denev, and Allen Ginsberg [1].
In a nutshell, the algorithm will select the most talked about drivers of the selected target, with a maximum of 5 to 10, then recursively the drivers of these drivers, with a maximum of 2 to 5. It then selects as many links as possible while maintaining the constraint that the graph is a Direct Acyclic Graph (DAG). Having the topology of the graph, and the estimates of the future evolution of all the nodes, it finally uses an optimization function to compute the joint probabilities distributions to complete the BBN.
We have selected here “Brazil inflation rate” as a target.
The result is a much smaller graph, which is centered on the selected target, as in Figure 2.
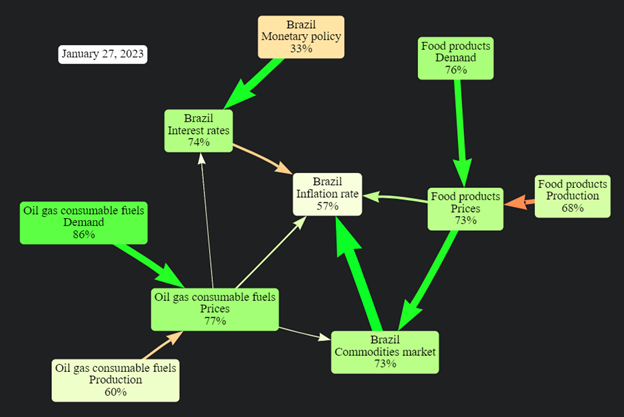
This graph shows that the Brazil Commodities Market (= commodities prices and market) has the strongest influence on Brazil Inflation Rate, and that they are positively correlated, while Brazil Interest Rates have a negative correlation with Brazil Inflation Rate. The Brazil Commodities Market itself is influenced by the price of food and the price of oil and gas.
The graph shows that increasing Brazil interest rates will have a negative impact (represented by red link color) on the inflation rate, while an increase of the commodities prices will have a positive impact (represented by green link color) on the inflation rate. The stronger relationship between the commodities prices and inflation rate (represented by the thickness of the link) suggests that controlling the commodities prices may have a greater impact on controlling inflation than controlling the interest rates.
This model is based on hundreds or thousands of statements, making it a compact representation of collective intelligence around the Brazil inflation rate. The transparency of the causal links in the model is also a valuable aspect. For example, the most recent link between the commodity prices and the inflation rate can be easily viewed. According to an article dated Dec 2, 2022, by Monica Scaramuzzo, “With the drop in commodity prices and the consequent beneficial effects that this generates to control inflation, we are already starting to speculate from central banks around the world if they will start reducing interest rates faster than initially anticipated.“[2].
It’s important to note that the presented Bayesian Network is a snapshot of the causal relationships between the economic entities at a single point in time. However, the Causality Link system is designed to accommodate the constantly evolving nature of these relationships. The BN generation algorithm can be run daily, allowing the Bayesian Network to be updated to reflect the latest information and trends found in the news articles. This means that the network can be used to make real-time predictions and analysis, providing up-to-date insights into the causal relationships between the economic entities. The daily updates ensure that the network remains relevant and accurate, making it a valuable tool for those interested in monitoring and understanding the economic landscape.
It is now possible to generate a file from the Causality Link BBN, and upload it into BayesiaLab, which will enable both further edition of the graph (nodes, links and probabilities) as well as the usage of the BBN as an analysis and simulation tool.
Leveraging the Bayesian Belief Network in a Simulation Environment
BayesiaLab is a powerful and user-friendly software platform that provides a complete “Bayesian network laboratory” for machine learning, knowledge modeling, probabilistic reasoning (including diagnosis and simulation), causal inference and optimization.
One of the key features of BayesiaLab is its advanced visualization capabilities. Users can view their Bayesian networks in a variety of ways, from simple node-link diagrams to more complex 3D graphs, which provide a better understanding of the domain.
The software also allows both experts and non-experts to interact with their networks, entering pieces of evidence or intervening on a subset of dimensions and observing their effects on other network dimensions.
In addition to these manual interactions, BayesiaLab also provides a wide range of advanced tools for sensitivity analysis and optimization. With these tools, BayesiaLab is an ideal platform for researchers and practitioners who want to work with Bayesian networks in a comprehensive and efficient manner.
Brazil Inflation Rate Network
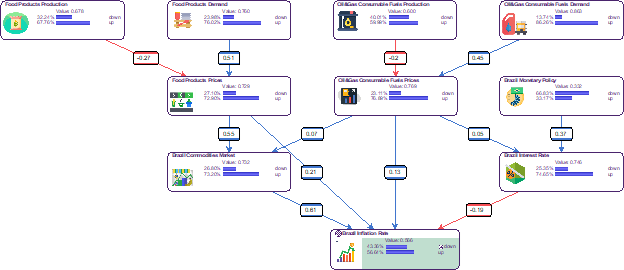
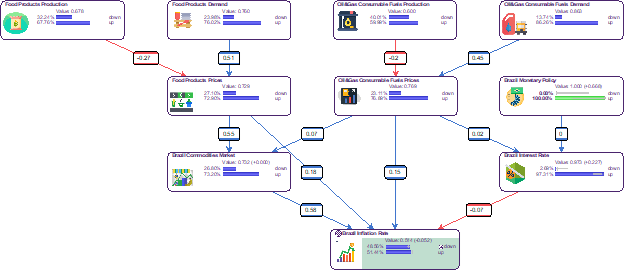
Figure 3. below represents the network generated by Causality Link as represented in BayesiaLab. Each of the ten dimensions of the domain is represented with a monitor, which contains the two states of the variable (down and up) along with their current probability. The color and the width of the links depend on the Pearson Coefficient associated with the relationship. We can therefore quickly see that the strongest relationship is between the “Brazilian Commodity Market” and the “Brazilian Inflation Rate”. We also see a negative relationship between the “Brazilian Interest Rate” and the “Brazilian Inflation Rate”.
What would be the impact of a change of Monetary Policy?
As indicated by its monitor, the current marginal probability distribution associated with “Brazilian Inflation Rate” is 43% – 57%. This means that, according to the analyzed set of documents that were used for inferring this network, and without any specific piece of evidence on the other dimensions of the network, the inflation rate will increase with a 57% chance.
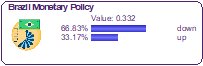
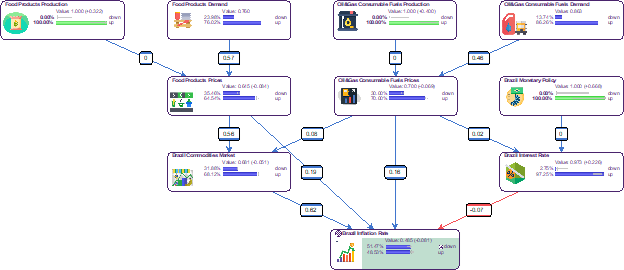
What would happen now if we were to intervene on the monetary policy? In other words, if we were to set the “up” probability of the “Brazilian Monetary Policy” node from 33% to 100%, how would it impact the distributions of other nodes in the network?
Based on this scenario, Figure 5 shows that this intervention increases “Brazilian Interest Rate” with a 97% chance, leading to an increase of the inflation rate with a 51% chance.
What would be the optimal policy for decreasing inflation?
Intervening on Brazil Monetary Policy has a very limited impact. What would be the optimal set of interventions to decrease the inflation rate?
Instead of manually interacting with the network to generate What-If scenarios, we will use BayesiaLab to automatically find out the optimal policy. Our drivers are “Food Products Production”, “Oil&Gas Consumable Fuels Production” and “Brazil Monetary Policy”, all other dimensions being outside our scope of intervention.
Figure 6 below represents the result of this optimization where the inflation rate goes down with a 51% of chance.
Reducing the inflation rate goes via the increase of the production of both food and oil&gas, and an increase of the monetary policy. Increasing the production decrease the associated prices, which has then a direct impact on the inflation rate but also an impact on commodities market.
What if we integrated a new dimension to our model?
Let’s suppose now that one of our analysts wants to improve the model by adding another driver, namely “Brazil Export Control”, to be able to represent an action that would have a direct impact on “Brazil Commodities Market”.
We create a binary node, and we connect it directly to “Brazil Commodities Market”. and the probability distribution described below, where we assume that the previous model did incorporate any export control.
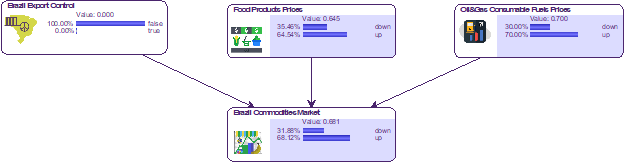
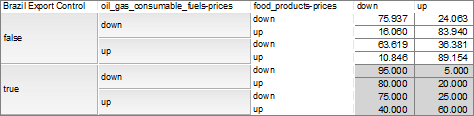
Figure 8 shows the conditional probability table associated with “Brazil Commodities Market”, where the second part of the table (in grey) has been elicited by our analyst. It represents his belief on the impact of export control. For example, having export control when the prices of oil&gas and food products are going up allow to increase the probability that “Brazil Commodities Market” goes down from 11% (4th row) to 40% (last row).
We now use BayesiaLab for finding what would be the required value for Export Control to stabilize the “Brazil Commodities Market”. Figure 9 shows the result of this optimization, which allows to decrease the inflation rate with a 60% chance.

BayesiaLab WebSimulator
Now that we have our final model, we can use BayesiaLab to generate a simulator to share it with our peers via the web.
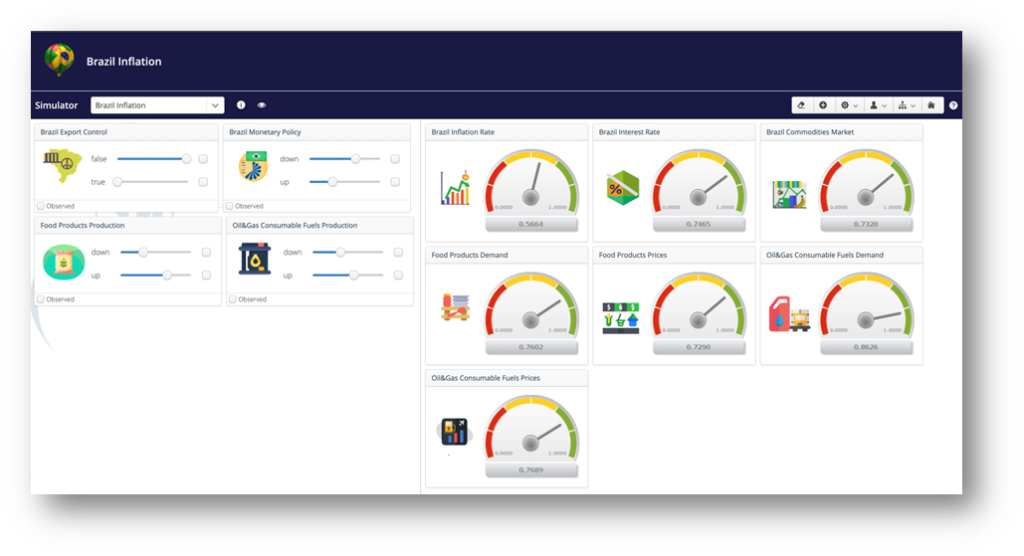
The left part contains the drivers, the right part the outputs of the model.
Maintaining the model
Once a model has been built and its results deemed satisfactory by its users, it is usual to want to reuse it over time, as market conditions change.
This issue of maintenance of the model can be tackled in multiple ways:
- If there were no manual modification in BayesiaLab, it is advisable to redo the whole generation cycle to consider the latest evolutions of the causal graph extracted from recent texts.
- If manual modifications were important, it is possible to re-generate the new BN version by Causality Link and manually perform the necessary updates in the previous BayesiaLab version.
- If the manual modifications were documented (through company-specific documentation for example), it is also possible to upload these specific documents into the Causality Link corpus and let them update the BN through the detection of the specific causal links that they contain.
Conclusion
This paper has provided an overview of the process of extracting Bayesian Networks from texts and its subsequent application in BayesiaLab. The extraction process involves deriving the structure of the graph from individual causal statements, populating the graph with probabilities and conducting a minimization procedure to ensure a valid conditional probability table. BayesiaLab provides a user-friendly platform to apply these Bayesian Networks to real-world scenarios. The software offers a range of features including the ability to conduct scenario analyses and manually add or curate factors and links.
The paper also presents an example of how Bayesian Networks have been used in BayesiaLab to analyze the factors influencing the Brazil inflation rate. The graphical representation of the Bayesian Network makes it easy to interpret the causal relationships between factors such as interest rates and commodity prices. Furthermore, the transparency of the causal links in the model provides further insight into the collective intelligence around the topic.
Collecting causal links from financial news at scale can provide a wealth of information and benefits for investors, researchers, data scientists, and CEOs/CFOs. By using causal links and gaining unique insights, stakeholders in the financial markets can make more informed decisions and gain a competitive edge. This competitive edge is enhanced with the ability to leverage these Causality Link-generated Bayesian Belief Networks inside the mathematical tool BayesiaLab. This tool transforms these BBNs into simulations enabling what-if scenarios as well as sensitivity analysis.
In conclusion, the automatically generated Bayesian Networks and their application in BayesiaLab have shown great potential in providing a compact and transparent representation of the collective intelligence on various economic topics. The ability to extract causal relationships from large amounts of text and present them in a visually appealing manner makes it easy for non-technical users to understand and make informed decisions. The potential for Bayesian Networks in BayesiaLab to revolutionize the way we make informed decisions based on collective intelligence is enormous, and we can expect to see more exciting developments in the near future.
About Causality Link and Bayesia
Causality Link has been extracting causal links from text since 2016. Over the years, we have built an archive with over 130M news articles in 27 languages and today, about 60K articles are analyzed in real time every day. By leveraging the power of natural language processing and machine learning, Causality Link provides investors and researchers with a wealth of valuable insights into the relationships between many economic indicators. This enables investors and researchers to stay ahead of the curve, better understand the future, and make more informed investment decisions.
Since 2001, Bayesia has been promoting expert knowledge elicitation, knowledge discovery, observational and causal reasoning with Bayesian networks to help organizations accelerate their search flows and make better decisions. Our flagship product, BayesiaLab, is now used by thousands of universities and companies. In this regard, our strategic partnership with Procter&Gamble has been instrumental in creating a powerful tool that extends beyond the academic world to the industrial and commercial world.
References:
[1] Laudy, O., Denev, A., & Ginsberg, A. (2022). Building Probabilistic Causal Models Using Collective Intelligence. The Journal of Financial Data Science, 4(2), 83-109. https://doi.org/10.3905/jfds.2022.1.091
[2] Scaramuzzo, M. (2022, December 2). Sustainability of public debt worries market, Morgan Stanley says. Retrieved from https://www.valor.com.br/financas/6370079/sustentabilidade-da-divida-publica-preocupa-mercado-diz-morgan-stanley
Sources:
Bayesian Networks, https://en.wikipedia.org/wiki/Bayesian_network
BayesiaLab, https://www.bayesia.com/
Causality Link, https://www.causalitylink.com/
Web-Simulator: https://simulator.bayesialab.com/#!simulator/83399618872